Frequently Asked Questions
General
What is SafeWithdrawls?
SafeWithdrawls is a retirement withdrawal planning tool that lets you compare 23 withdrawal strategies side-by-side. You enter your financial situation, select the methods you want to test, and see multi-decade projections with charts and tables. See What is SafeWithdrawls? for a full overview.
Is SafeWithdrawls free?
SafeWithdrawls is currently free to use with no account required. A premium tier with additional features may be introduced in the future, but the core comparison tool will remain accessible.
Is this financial advice?
No. SafeWithdrawls is an educational tool designed to help you understand and compare withdrawal strategies. It does not provide personalized financial advice. Always consult a qualified financial advisor before making retirement decisions.
Who built SafeWithdrawls?
SafeWithdrawls was built by Travis Giffin (LinkedIn), a career SaaS technologist, as a solo project. It grew out of a desire to make the academic research on withdrawal strategies more accessible and easier to compare in one place. Key influences include AllocateSmartly and Todd Tresidder's FinancialMentor.com.
What data does SafeWithdrawls use?
SafeWithdrawls uses annual U.S. stock and bond returns from 1928 through 2024 -- nearly a century of actual market history. This dataset includes every major crash, recovery, and inflationary period in modern market history.
Methodology
Why doesn't SafeWithdrawls use Monte Carlo simulation?
Monte Carlo simulation assumes returns follow a normal (bell-curve) distribution, which systematically underestimates extreme market events like the 2008 financial crisis. SafeWithdrawls uses bootstrap sampling instead, which preserves the fat tails, volatility clustering, and real correlations found in actual market data. See Our Methodology for a detailed comparison.
What is bootstrap sampling?
Bootstrap sampling builds return sequences by randomly drawing from actual historical returns rather than generating synthetic returns from a statistical model. Because it uses real data, it automatically captures fat tails, volatility clustering, and other features that simplified models miss. See Our Methodology for how this works step by step.
What historical data does SafeWithdrawls use?
Annual U.S. stock and bond returns from 1928 through 2024. This includes the Great Depression, World War II, stagflation of the 1970s, the dot-com bust, the 2008 financial crisis, and the COVID-19 crash.
How are crisis scenarios generated?
Crisis scenarios replay the actual sequence of historical returns starting from a specific year. They are not random samples. The five available starting years are 1929 (Great Depression), 1972 (stagflation), 2000 (dot-com crash into 2008 crisis), 2007 (global financial crisis), and 2020 (COVID-19 crash).
What are the success metrics?
SafeWithdrawls measures success along two dimensions: Portfolio Health (how well your portfolio survives over time) and Need Coverage (whether your withdrawals meet your actual spending needs). These combine into an Overall Score that captures both portfolio sustainability and quality of life in retirement.
Methods
Which withdrawal method is best for me?
There is no single best method -- it depends on your priorities. If you value simplicity, start with the 4% Rule. If you want spending that adapts to market conditions, explore guardrail strategies like Guyton-Klinger or Floor-Ceiling. The Scenario Builder lets you compare any combination to see the trade-offs with your specific numbers.
Can I compare multiple methods at once?
Yes -- this is the core feature of SafeWithdrawls. You can select any combination of the 23 methods and see them projected side-by-side on the same chart and table, all using your specific inputs.
What's the difference between the 4% Rule and Fixed Percentage?
The 4% Rule withdraws 4% of your initial portfolio value, adjusted for inflation each year -- so the dollar amount changes but the real spending stays flat. Fixed Percentage withdraws a set percentage of your current portfolio value each year, so the dollar amount rises and falls with the market.
Why does Guyton-Klinger allow a higher initial withdrawal rate?
Guyton-Klinger uses decision rules that cut spending when the portfolio drops and raise it when the portfolio grows. Because you agree to reduce spending during downturns, you can start with a higher withdrawal rate (often 5%+) while maintaining a similar overall success rate to more conservative fixed strategies.
What is a "guardrail" strategy?
A guardrail strategy sets upper and lower bounds around your withdrawal rate. When your portfolio grows enough to push the withdrawal rate below the lower guardrail, you get a raise. When the portfolio drops enough to push the rate above the upper guardrail, you take a cut. This balances portfolio safety with spending stability. Methods in this category include Floor-Ceiling, Ratcheting, and Dynamic Withdrawal.
Technical
How are returns generated for projections?
For standard projections, SafeWithdrawls uses block bootstrap sampling -- randomly drawing blocks of consecutive annual returns from the 1928-2024 historical dataset. For crisis scenarios, it replays the actual historical return sequence starting from a specific year. See Our Methodology for details.
What assumptions does SafeWithdrawls make?
Key assumptions include: returns are drawn from U.S. market history (1928-2024), inflation adjustments use historical CPI data, asset allocation remains fixed at your specified stock/bond split, and no taxes or transaction costs are modeled. Each method page documents its specific assumptions.
Why 23 methods? Are there more?
The 23 methods cover the major approaches found in academic research and financial planning practice, organized into six categories: Fixed-Rate, Guardrail-Dynamic, Life-Expectancy, Valuation-Based, Income-Coordinated, and Cash-Flow Matching. Additional methods may be added in the future, but the current set captures the most widely studied and practically relevant strategies.
Can I test my own custom return sequences?
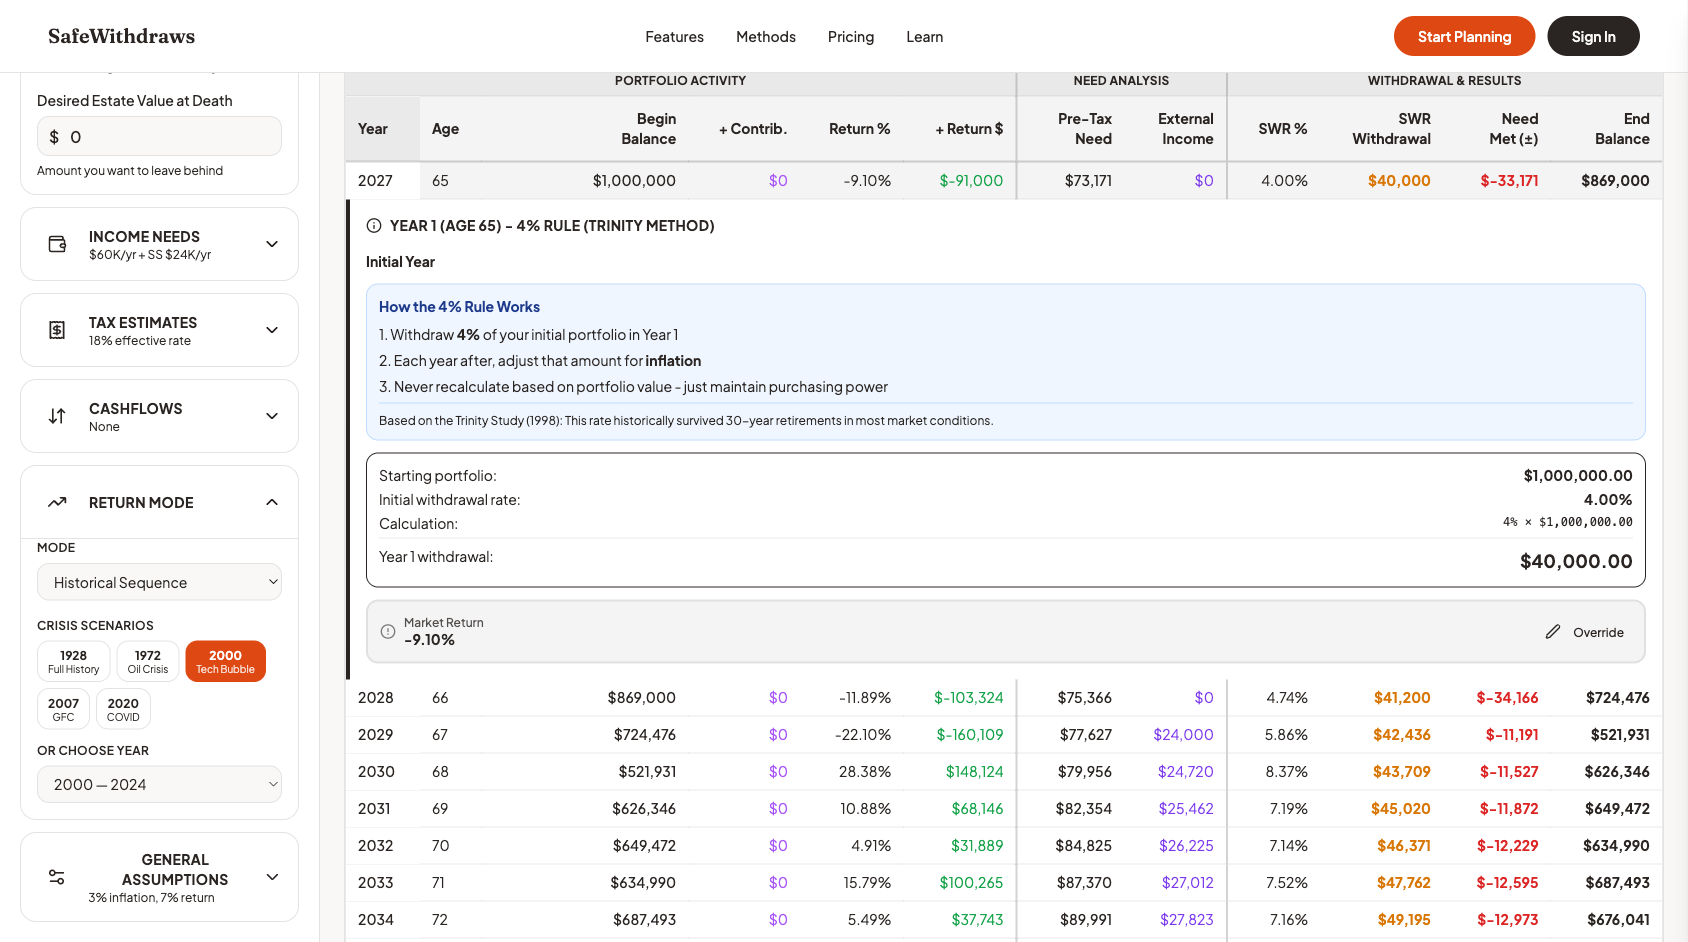
Yes. While SafeWithdrawls generates return sequences automatically using bootstrap sampling or historical replay, you can override the return percentage for any individual year directly in the projection table. Click any year row to expand it, then use the Override button next to the Market Return to enter your own value. This lets you manually adjust the sequence to test specific scenarios — for example, inserting a -40% crash in Year 3 to see how your strategy responds.