Quick Start Guide
This guide walks you through your first scenario in SafeWithdrawls. By the end, you will have compared multiple withdrawal strategies and understand how to read the results.
Step 1: Open the Scenario Builder
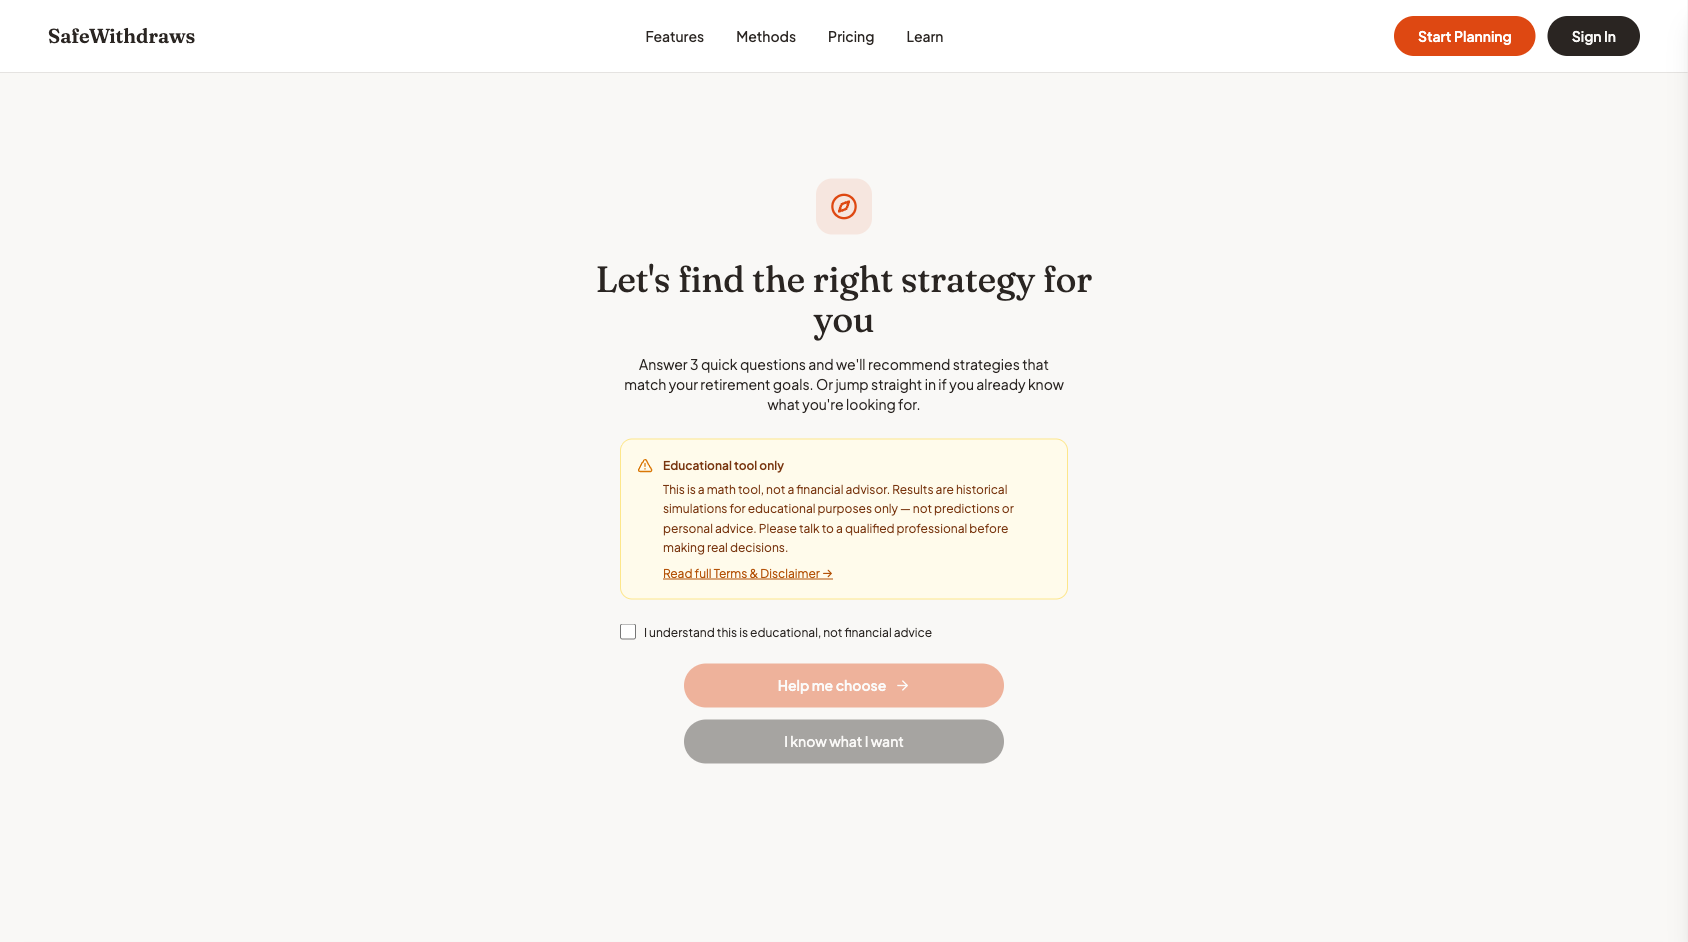
When you first visit SafeWithdrawls, you will see a welcome screen with a brief disclaimer. After accepting the disclaimer (a one-time step), you will land on the Scenario Builder -- the main workspace where all analysis happens.
The Scenario Builder has two main areas:
- Input Panel (left side or drawer on mobile) -- where you enter your financial details and select methods
- Results Area (main content) -- where charts, scores, and projections appear
Step 2: Enter Your Financial Details
The input panel asks for the key numbers that drive your retirement projections:
Portfolio
- Starting Portfolio Value -- Your total investable assets at retirement (e.g., $1,000,000)
- Asset Allocation -- The split between stocks and bonds (e.g., 60% stocks / 40% bonds)
Expenses
- Annual Expenses -- How much you need to withdraw each year to cover living costs (e.g., $40,000)
- Inflation Adjustment -- Whether expenses grow with inflation over time
Time Horizon
- Current Age -- Your age at the start of retirement
- Planning Horizon -- How many years to project (typically 30--40 years)
Income Sources
- Social Security -- Expected annual benefit and the age you plan to start collecting
- Other Income -- Pensions, annuities, or other reliable income streams
All inputs update results in real time -- there is no "Run" button to click. As you change a number, the charts and scores recalculate immediately.
Step 3: Select Methods to Compare
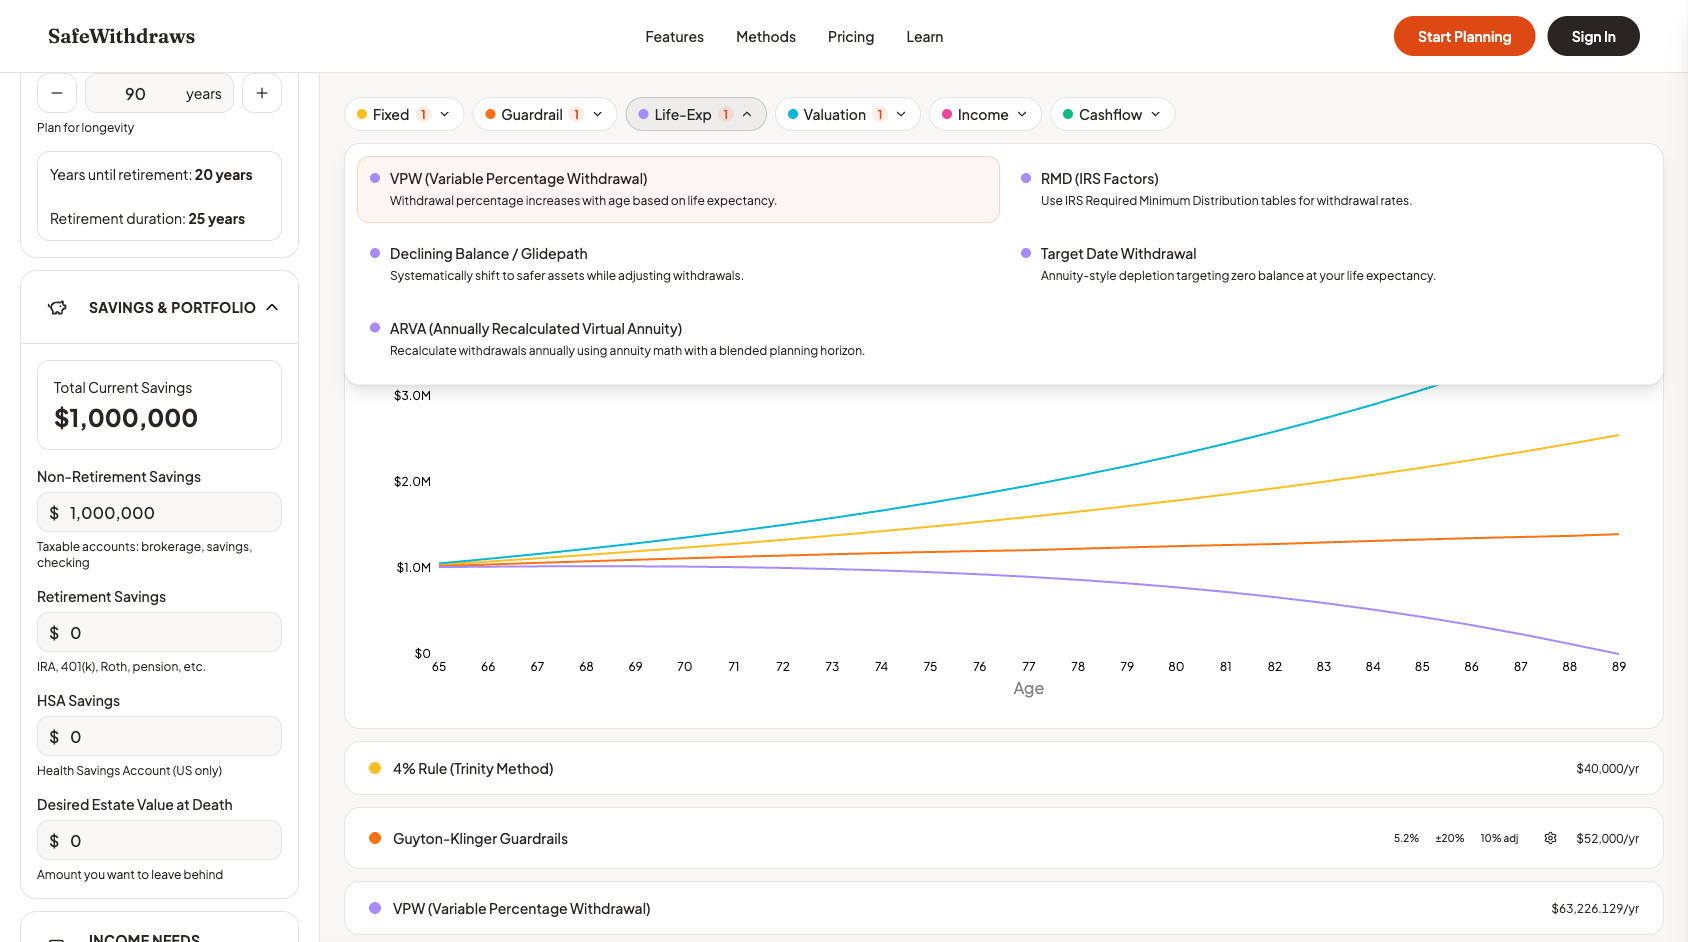
Below your financial inputs, you will find the method selection panel. SafeWithdrawls offers 23 withdrawal strategies organized into six categories:
- Fixed-Rate -- Simple, predictable approaches like the 4% Rule
- Guardrail-Dynamic -- Strategies that adjust based on portfolio performance
- Life-Expectancy -- Methods that scale withdrawals to your remaining lifespan
- Valuation-Based -- Approaches that respond to market valuations
- Income-Coordinated -- Strategies that work alongside Social Security or annuities
- Cashflow-Matching -- Methods that dedicate assets to specific expenses
Tip for your first scenario: Start with 2--3 methods from different categories. A good first comparison might be:
- 4% Rule (Fixed-Rate) -- The classic benchmark
- Guyton-Klinger (Guardrail-Dynamic) -- A popular adaptive strategy
- VPW (Life-Expectancy) -- Variable Percentage Withdrawal, which adjusts to life expectancy
This gives you a fixed strategy, a dynamic strategy, and a life-expectancy strategy to compare side-by-side.
Step 4: Read the Results
Once you have entered your details and selected methods, the results area shows several views of your projection.
Portfolio Chart
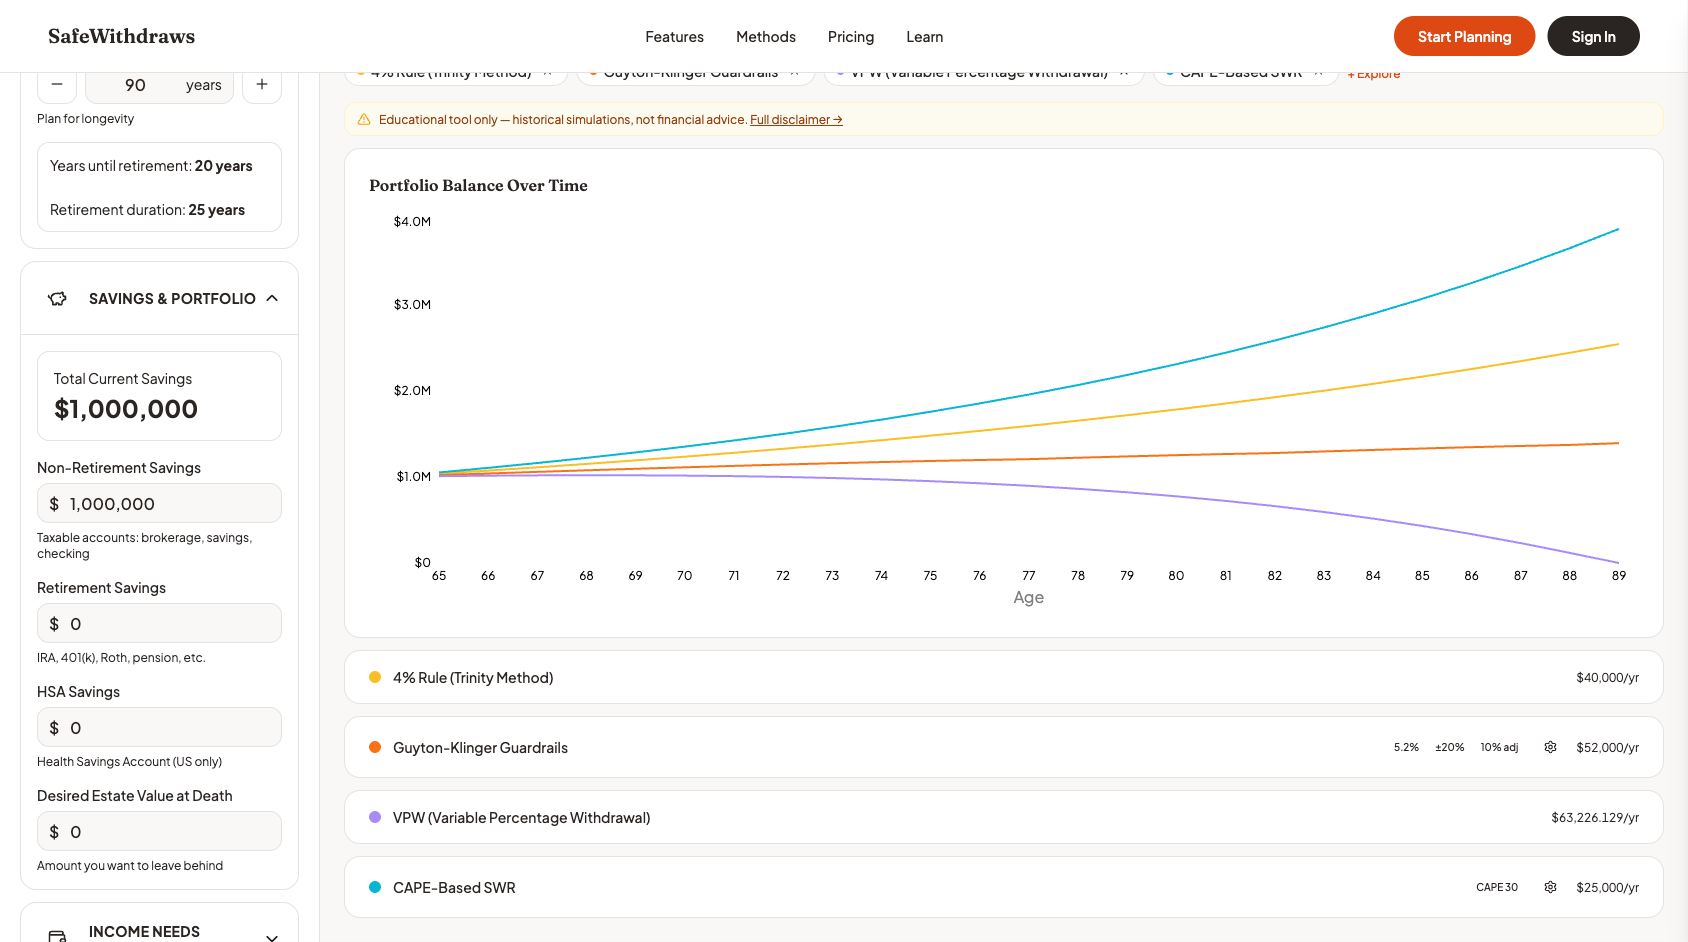
The main chart shows each method's projected portfolio balance over time. Each method appears as a separate colored line, making it easy to see which strategies preserve more wealth and which deplete the portfolio faster.
Look for:
- Lines that reach zero -- These strategies ran out of money before your planning horizon ended
- Lines that grow -- These strategies may be withdrawing too conservatively
- Lines that decline gradually -- Often the most balanced approaches
Success Scores
Above the chart, you will see three scores for each method:
Portfolio Health Score
This measures whether the portfolio survives the entire projection period. A score of 100 means the portfolio never runs out of money. A lower score indicates the portfolio was depleted before the end of your planning horizon.
Need Coverage Score
This measures whether your annual withdrawals actually meet your stated expenses. A strategy might keep your portfolio alive for 40 years, but if it forces you to withdraw 30% less than you need during downturns, that matters. A score of 100 means every year's withdrawal met or exceeded your expense target.
Overall Score
This combines Portfolio Health and Need Coverage into a single number. It penalizes strategies that sacrifice one dimension for the other -- you want both a surviving portfolio and adequate income.
Year-by-Year Projections Table
Below the chart, you can expand a detailed table showing each year of the projection. For every method, you can see:
- Portfolio balance at the start of the year
- Withdrawal amount for that year
- Investment return applied to the portfolio
- End-of-year balance after withdrawals and returns
This table is especially useful for understanding the mechanics of each strategy -- why one method withdraws more in year 5 but less in year 15, for example.
Step 5: Test Against Crisis Scenarios
After reviewing your baseline results, try stress-testing with historical crisis scenarios. The scenario selector lets you choose a specific starting year:
| Scenario | What It Tests |
|---|---|
| 1929 Start | Retiring into the Great Depression -- the ultimate stress test |
| 1972 Start | Stagflation era with high inflation eroding purchasing power |
| 2000 Start | Dot-com crash followed by the 2008 financial crisis -- a "lost decade" |
| 2008 Start | Retiring at the start of the global financial crisis |
| 2020 Start | COVID crash with rapid recovery |
Crisis scenarios reveal which strategies are truly resilient and which only look good in average conditions. A method that scores well in both normal and crisis scenarios deserves more confidence than one that only works when markets cooperate.
Tips for Getting the Most Out of SafeWithdrawls
Start Simple, Then Explore
Begin with 2--3 methods and your best-guess inputs. Once you understand the results format, add more methods and experiment with different assumptions.
Change One Variable at a Time
When exploring "what if" scenarios, change a single input (like reducing your portfolio by 20%) and observe how each method responds. This builds intuition about which strategies are sensitive to which inputs.
Compare Across Categories
Methods within the same category tend to behave similarly. The most revealing comparisons are between categories -- for example, a fixed-rate approach versus a guardrail approach versus a life-expectancy approach.
Pay Attention to Need Coverage
It is tempting to focus only on whether the portfolio survives, but Need Coverage tells you whether you can actually maintain your lifestyle. A strategy with 100% Portfolio Health but 70% Need Coverage means you are cutting spending significantly in many years.
Use Crisis Scenarios for Confidence
If a strategy performs reasonably well in the 2000-start scenario (dot-com crash followed by the financial crisis), it has been tested against one of the worst sequences of returns in modern history. That is a meaningful stress test.
Next Steps
- What is SafeWithdrawls? -- Understand the tool's approach and philosophy
- Methodology -- Learn how bootstrap sampling creates realistic projections
- Method Reference -- Deep dive into any of the 23 withdrawal strategies